It Takes How Long? Comparing U.S. Representative Spending to Minimum Wage
Tipped workers are subject to the mercy of the consumer responsible and fluctuating paychecks while taxes are withdrawn so their local representative can spend thousands of taxpayer dollars on advertisements (frankly junk mail). Regardless of political affiliation United States Representatives are spending in a way many of their constituents can only dream of.

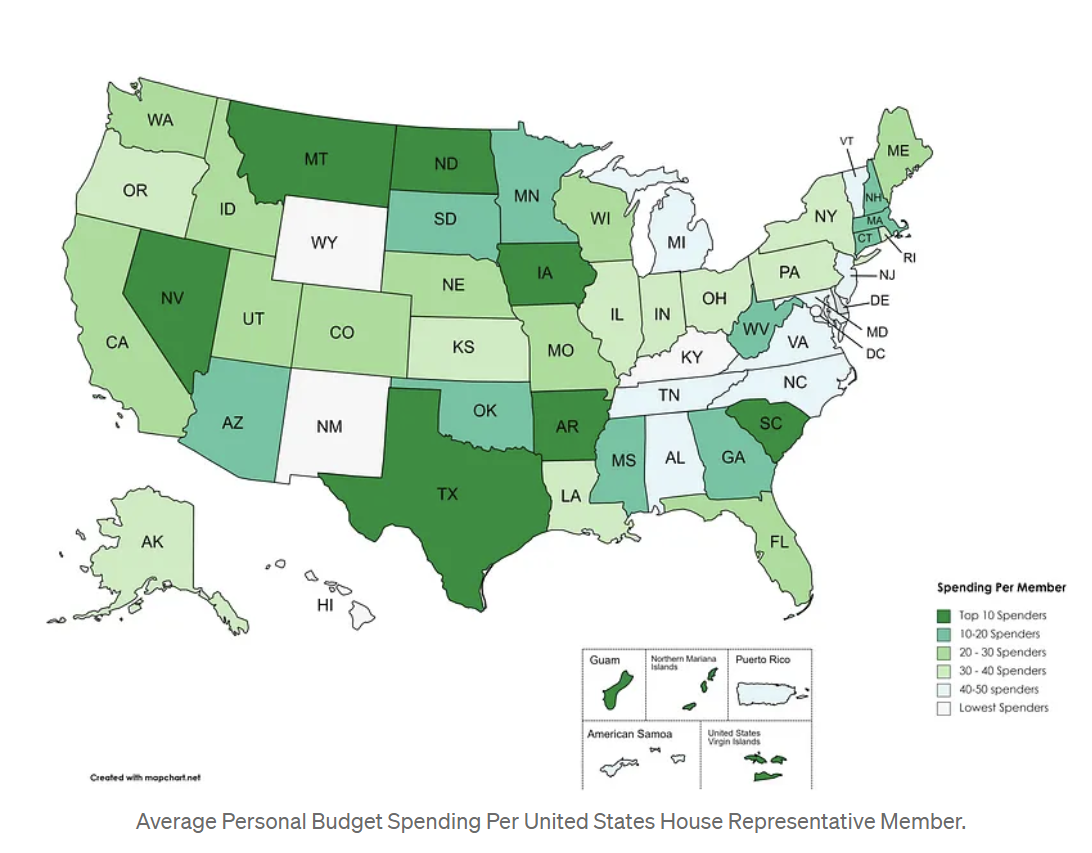
First, let’s consider the average spending by state. This shows some diversity in geographic areas with some larger states averaging more than others, but with exceptions. South Carolina, Arkansas, and Iowa are outliers here. Average spending for one of the seven South Carolina Representatives is $53,970. It takes a minimum wage worker over three and a half years to gross this sum.
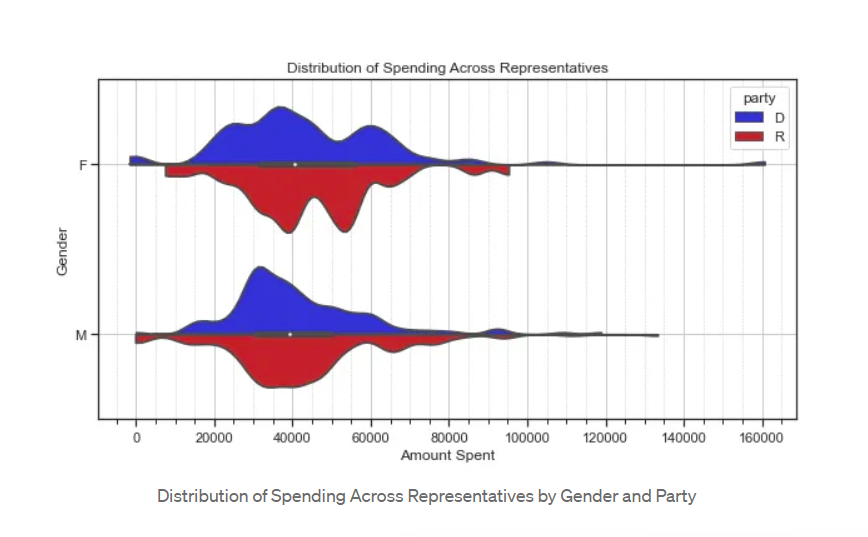
Considering some underlying factors such as gender or party affiliation, there is no difference in average spending. Female members on average spend $3,000 more than their male counterparts, however North Carolina Representative Alma Adams (D) may skew this. Out of all 452 members she is the highest spender in the three-month period at $160,614. It would take a minimum wage worker in her state ten years to make this much money.
Representative Adams spent $30,000 more than Alabama Representative Robert Aderholt (R), the second highest spender. A average meal charge for Representative Aderholt is $60.85, it would take a minimum wage worker one overtime shift to be able to afford this. In a recent press release Representative Aderholt said “The President’s budget is a non-starter for Americans. Now only does in not roll back unnecessary spending, but increases much of it by wide margins.” He then proceeded to criticize the use of taxpayer dollars for administering abortions. It would take a minimum wage worker three months to afford the monthly rent of Representative Aderholt’s three separate district offices. Representative Aderholt is ranked #2 out of 452 House of Representative Members for spending. His quarter 3 spending totals $133,316. A minimum wage worker in his state would have to work almost nine years to afford what Rep. Aderholt spent in three months. In both North and South Carolina there is no other laws to increase minimum wage, it remains at the federal rate.

Most Representatives are spending over $25,000 in quarter 3. It would take a minimum wage worker over one and a half years to make just $25,000. On average a Republican Representative spends $842 more than the Democrat. This difference is marginal and shows little disparity in how representatives are spending their budgets. This is the low end, many states such as Texas or New York have average per member spending at $52,353 and $40,055 respectively.
Texas has 37 Representatives, two of them being Jodey Arrington (R) and Colin Allred (D). They are the 8th and 9th highest spending Representatives. Travel expenses belonging to Representative Arrington sum to $6,573, half of which are “Private Auto Mileage”. It would take a minimum wage worker in his state 906 hours or twenty two weeks of full time work. This does not include time for commuting. Another interesting charge was $1,589 belonging to Representative Allred. This was a charge back onto his credit card for ‘Office Supplies (Outside)’ on 3/31/2021. The data doesn’t reveal any other details, however, it’s something to consider. Representatives are able to use their personal credit card and have the government refund the purchases. The track on this is minimal, and as seen here has few details to track the actual purchases.
While this analysis doesn’t prove anything about current legislation or personal agendas it does add perspective. Putting government spending allowances in a temporal understanding with minimum wage work is eye opening. While members are spending within their rights, it is well above the capacity of their constituents. Tipped workers are subject to the mercy of the consumer responsible and fluctuating paychecks while taxes are withdrawn so their local representative can spend thousands of taxpayer dollars on advertisements (frankly junk mail). Regardless of political affiliation United States Representatives are spending in a way many of their constituents can only dream of.