Place in America: Your Death Sentence
In the United States of America our average life expectancy is 75 years old — and it’s declining. If you aren’t familiar with the term, it summarizes the average number of years lived at birth. It is not affected by age structures because it is based on the set of age-specific death rates for the particular year.

This data is derived from demographic data even down to the county level. For example, the University of Wisconsin annually publishes the County Health Rankings & Roadmaps (CHR&R). This dataset allows demographers to provide an in-depth county analysis at disparities within America or make broad health generalizations. When comparing the United States to its ‘peer countries’ this is weighted in economic terms.
Peer countries are similar in economic structure to the United States which provides an even field for comparison. But, do economic differences fare the same across all populations in the United States? Within our lethal environment it consists of the drug environment, obesogenic environment, replacement of energy forces, and firearm usage. These factors create a unique health environment within the United States resulting in a lag in our life expectancy (Barbieri 2022).
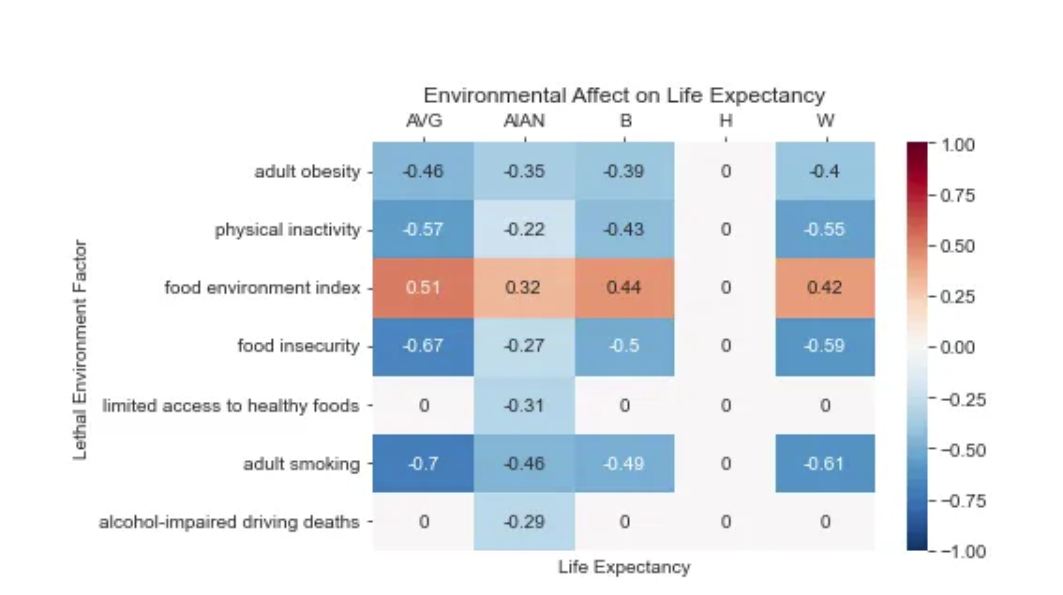
So, what affect does income have within the United States life expectancy? To find this answer I used the CHR&R 2021 publication of all U.S counties and found the correlates between the rates of lethal environment variables, life expectancy, and pre-mature age adjusted mortality. The correlates measure the strength of the relationship between two variables. For example, the correlation between life expectancy and adult smoking is -0.7. This means in counties with higher adult smoking the life expectancy decreases.
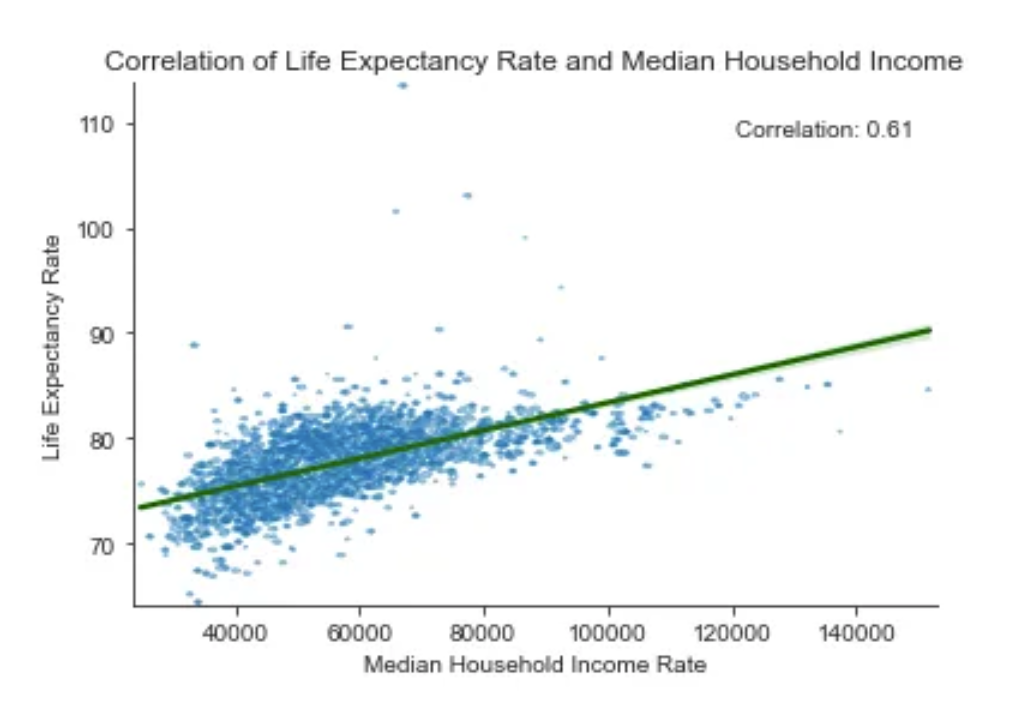
On the below graph, each blue dot is the median household income (MHI) of each county. The green line measures the correlation between life expectancy and MHI, at a value of 0.61. As the MHI increase in a county the life expectancy does too. Something that is interesting in this graph is counties with a MHI have lower life expectancy rates than counties in lower deciles. This trend only holds true in White populations in compared to other groups.

When measuring demographic data, it typically asks questions about race and ethnicity. This has generated problems in historical comparisons and data because the categories are arbitrary. Typically, the census classifies those who identify as Hispanic as ‘other’ and select yes for ethnicity. These measures also exclude individuals who identify as Middle Eastern entirely. These limitations have to be understood when analyzing this data, however, historical oppression plays a strong factor in one’s life course and health outcomes.
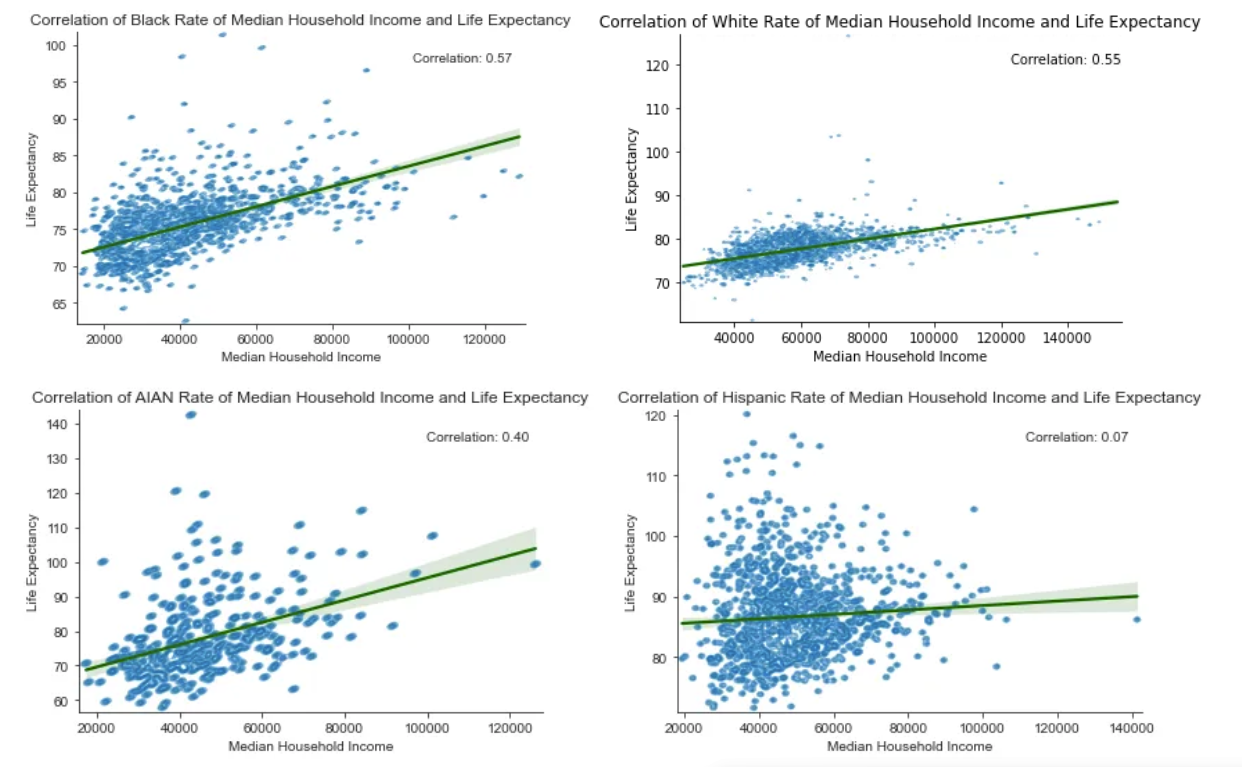
The demographic categories included in the CHR&R are Hispanic, Black, White, and American Indian and Alaskan Native (AIAN) populations. It also reports specific median income and life expectancy for these groups. The below relationships have used variables appropriate to each group to not compare them to a different median income.
How are these groups differentially impacted by median household income compared to the United States average? It is to note on the below graphs the only x-axis that starts at 40,000 is White median income. This alone demonstrates the disproportionate spread of income among different groups. Those who are most similar to the general correlation are Black and White groups with a correlation of .57 and .55 respectively. This means for these groups your median household income plays a role in your health outcomes substantially. This is further exacerbated by proximate factors such as cigarette smoking, which has the greatest affect on White populations (-0.61). Cigarette smoking can be attributed to causing the six out of the ten top causes of death in 2014. Although this is an individual behavior it is the social conditions that push people to use smoking as a vice, necessitating and intervention at a wider scale.

AIAN provides a lower correlation (.40) than the Black and White populations, however the concentration of low life expectancy and small spread of income limits the strength of the correlation. Interestingly, AIAN life expectancy is impacted the lowest by living in the positive food environment (.32) in comparison to the average (.50). This still supports that income matters when considering life expectancy to some degree.
The one outlier in these correlations are people who identify as Hispanic. Not only do they have a near zero correlation for income and life expectancy, but this also applies to all other lethal environmental factors. Many health scholars have identified this as the “Hispanic Health Paradox”, which in itself does not apply evenly to everyone, creating a paradox within the paradox, a NY times article calls it. This life expectancy advantage is not “Hispanic” but applies to “foreign-born Other Hispanics and foreign born- Mexicans) (Palloni, 2004). However, with longer life expectancy this comes with a higher rate of disability in later life.

While income is not the only proximal factor in health outcomes it plays a large role. In the shift to individualization of health behaviors this has greatened disparities within the United States socio-economic (SES) deciles. This creates food deserts, higher allostatic loads, and lessened access to safe neighborhoods for healthy activities. Between 1982 and 2019 the life expectancy gap between SES deciles grew 3.5 years (Barbieri, 2022). This gap cannot be attributed to the individual level of income, this structure was baked into the United States as we developed over the 20th century.
Income is an important correlate to understand the life course on a meso level within the United States, however, on a macro scale it does not matter. Every single county is performing below the international average in life expectancy. Americans are dying sooner every year, which began to lag behind as early as the 1980s (Harris et al: 2021). COVD — 19 further exacerbated these gaps, especially among already marginalized groups. This necessitates a national health intervention looking outside the United States for solutions.
Sources:
Anon.n.d. “Explore Health Rankings Rankings Data & Documentation.” County Health Rankings & Roadmaps. Retrieved April 28, 2023 (https://www.countyhealthrankings.org/explore-health-rankings/rankings-data-documentation).
Barbieri, Magali. 2022. “Socioeconomic Disparities Do Not Explain the U.S. International Disadvantage in Mortality.” The Journals of Gerontology: Series B 77(Supplement_2):S158–66. doi: 10.1093/geronb/gbac030.
Harris, Kathleen Mullan, Malay K. Majmundar, and Tara Becker, eds. 2021. High and Rising Mortality Rates Among Working-Age Adults. Washington, D.C.: National Academies Press.
Palloni, Alberto, and Elizabeth Arias. 2004. “Paradox Lost: Explaining the Hispanic Adult Mortality Advantage.” Demography 41(3):385–415. doi: 10.1353/dem.2004.0024.