Political Stances: Decision Tree Code
7. Decision Trees
The purpose of this notebook is to generate decision trees for the climate related headlines and the introduced climate bills. This will inform what is semantically meaningful to assigning something to a particular label.
1. Environment Creation
1.1 Library Import
''' DATA MANAGEMENT '''
import sklearn
import pandas as pd
from sklearn.model_selection import train_test_split
import os
import ast
from collections import Counter
import regex as re
import numpy as np

''' VECTORIZATION '''
from sklearn.feature_extraction.text import CountVectorizer


''' DATA VISUALIZATION '''
import seaborn as sb
from wordcloud import WordCloud
import matplotlib.pyplot as plt
import pyLDAvis
import graphviz
from mpl_toolkits.mplot3d import Axes3D
from mpl_toolkits.mplot3d import Axes3D
from IPython.display import Image
import pydotplus
from matplotlib.ticker import MultipleLocator
from matplotlib.ticker import AutoMinorLocator
from tabulate import tabulate

''' SANITY '''
from tqdm import tqdm

''' DECIISION TREE '''
from sklearn.tree import DecisionTreeClassifier, plot_tree
from sklearn import tree

''' MODEL VERIFICATION  '''
from sklearn.metrics import silhouette_samples, silhouette_score
from sklearn import metrics
from sklearn.metrics import precision_score, recall_score, accuracy_score, balanced_accuracy_score
from sklearn.metrics import confusion_matrix
from sklearn.utils.multiclass import unique_labels
1.2 Function Definition
def train_test_splitter(data, label_column):

    data_train, data_test = train_test_split(data, test_size = 0.3,)
    labels_train = data_train[label_column]
    labels_test = data_test[label_column]

    #data_train.drop(columns='LABEL', inplace=True)
    #data_test.drop(columns='LABEL', inplace=True)


    return (data_train, data_test, labels_train, labels_test)
def visual_confusion_matrix(labels, predictions ,title, label_name, file_name, fig_x, fig_y):

    _labels = sorted(set(labels).union(set(predictions)))

    matrix_ = confusion_matrix(labels, predictions, labels=_labels)
    confusion_df = pd.DataFrame(matrix_, index=_labels, columns=_labels)

    fig, ax = plt.subplots(figsize=(fig_x, fig_y))


    sb.heatmap(confusion_df, annot = True, fmt='d', xticklabels=_labels, yticklabels=_labels, cbar_kws={'shrink': 0.5}, ax=ax)
    ax.set_title(f"Confusion Matrix:\n{title}\nLabels: {label_name}")
    ax.set_ylabel("True Labels")
    ax.set_xlabel("Predicted Labels")

    ax.set_aspect('equal', adjustable='box')
    #plt.subplots_adjust(left=0.15, right=0.85, top=0.85, bottom=0.15)

    # Save and show the plot

    plt.tight_layout(pad=.5)
    plt.savefig(file_name, dpi=600)

    plt.show()
def model_verification(true_labels, predictions):
    accuracy = accuracy_score(true_labels, predictions)
    precision = precision_score(true_labels, predictions, average='macro', zero_division = 0)
    recall = recall_score(true_labels, predictions, average='macro', zero_division = 0)

    return accuracy, precision, recall
def filter_top_n_labels(labels, predictions, N):
    matrix_ = confusion_matrix(labels, predictions)
    label_sums = matrix_.sum(axis=1)

    top_labels_indices = label_sums.argsort()[-N:][::-1]

    unique_labels = sorted(set(labels))
    top_labels = [unique_labels[i] for i in top_labels_indices]

    mask = [yt in top_labels or yp in top_labels for yt, yp in zip(labels, predictions)]

    labels_filtered = [yt for yt, m in zip(labels, mask) if m]
    predictions_filtered = [yp for yp, m in zip(predictions, mask) if m]

    return labels_filtered[0:N], predictions_filtered[0:N]
## Decision Tree Modeler:
def tree_modeler(data_train, labels_train, data_test, labels_test, label_column_name, graph_title, labels_name, file_name,filter_top_n = False, N=10 ,fig_x = 6, fig_y = 4):
data_train = data_train.drop(columns = label_column_name).copy()
data_test = data_test.drop(columns = label_column_name).copy()
feature_names_train = list(data_train.columns)
feature_names_test = list(data_test.columns)
decision_tree = DecisionTreeClassifier(criterion='entropy', ## This is changed based on the model test that was used
splitter = 'best',
max_depth = 7,
min_samples_split = 10,
min_samples_leaf = 10,
max_features = 500,
random_state = 30,
max_leaf_nodes = None,
min_impurity_decrease = 0.0,
class_weight = 'balanced')
## Fitting the data
decision_tree_model = decision_tree.fit(data_train, labels_train)
tree.plot_tree(decision_tree,feature_names = feature_names_train)
plt.savefig(f"Decision Tree - {file_name}.png")
## Plotting the tree
dot_data = tree.export_graphviz(decision_tree_model, out_file=None,
feature_names=feature_names_train,
class_names = [str(cls) for cls in decision_tree_model.classes_],
filled=True,
rounded=True,
special_characters=True,
label='all', proportion = True
)
cleaned_dot_data = re.sub(r'value = \[[^\]]*\]<br/>|value = \[[^\]]*\]<br/?>', '', dot_data)
graph = graphviz.Source(cleaned_dot_data)
graph.render(f"Decision Tree - {graph_title}",cleanup=True)
## Creating predictions
predictions = decision_tree_model.predict(data_test)
## Assessing the models abilitiy
accuracy, precision, recall = model_verification(labels_test, predictions)
## Filtering for Clean Visualizations
## Filtering for Clean Visualizations
if filter_top_n:
# Call filter_top_n_labels to get filtered labels and predictions
labels_test_filtered, predictions_filtered = filter_top_n_labels(labels_test, predictions, N)
# If data remains after filtering, create the filtered confusion matrix
if len(labels_test_filtered) > 0 and len(predictions_filtered) > 0:
visual_confusion_matrix(labels_test_filtered, predictions_filtered,
f"{graph_title} (Top {N})", labels_name,
f"filtered_{file_name}", fig_x, fig_y)
else:
print(f"[Warning] No data left after filtering top {N} labels — skipping confusion matrix.")
else:
# If no filtering is needed, generate confusion matrix with all data
visual_confusion_matrix(labels_test, predictions, graph_title, labels_name, file_name, fig_x, fig_y)
return (accuracy, precision, recall)
1.3 Data Import
news_data = pd.read_csv(r"C:\Users\natal\OneDrive\university\info 5653\data\News Articles Lemmed- Count Vectorizer.csv")
news_data.fillna(0,inplace=True)
news_data.drop(columns='Unnamed: 0', inplace = True)

non_zero_condition = news_data['Party'] != 0
news_data = news_data[non_zero_condition]
bills_data = pd.read_csv(r"C:\Users\natal\OneDrive\university\info 5653\data\Bills Lemmed- Count Vectorizer.csv")
bills_data.fillna(0,inplace=True)
bills_data.drop(columns='Unnamed: 0', inplace = True)

non_zero_condition = bills_data['Committees'] != 0
bills_data = bills_data[non_zero_condition]
party_data = pd.read_csv(r"C:\Users\natal\OneDrive\university\info 5653\data\Party Platform Lemmed- Count Vectorizer.csv")
party_data.drop(columns='Unnamed: 0', inplace = True)
''' REVECTORIZING DATA '''

## Recreate CountVectorizer with the original vocabulary
vectorizer_news = CountVectorizer(vocabulary=news_data.columns)
vectorizer_bills = CountVectorizer(vocabulary=bills_data.columns)
vectorizer_party = CountVectorizer(vocabulary=party_data.columns)
''' PULLING OUT THE FEATURE NAMES '''
features_news = news_data.columns.to_list()
features_bills = bills_data.columns.to_list()
features_party = party_data.columns.to_list()

## Removing the labels
features_news = features_news[2:]
features_bills = features_bills[4:]
features_party = features_party[1:]
''' CREATING A COMBINED LABEL COLUMN FOR MORE LABEL INFORMATINO IN SKLEARN '''

news_data.insert(0, 'LABEL', news_data['Party'].astype(str).fillna('') + ' | ' + news_data['publisher'].astype(str).fillna(''))

## note: the committee was not added to this because of the diversity and length  of the committee
## - so the purpose of this column is more in order to generate a nunance about sponser state, affiliation,
## and bill type
bills_data.insert(0, 'LABEL', bills_data['Bill Type'].astype(str).fillna('') + ' | ' + bills_data['Sponser Affiliation'].astype(str).fillna('') +' | ' + bills_data['Sponser State'].astype(str).fillna(''))
''' STORING THE LABELS '''

## News Data
labels_news_party = news_data['Party'].to_list()
labels_news_publisher = news_data['publisher'].to_list()
labels_news_combined = news_data['LABEL'].to_list()

## Bill Data
labels_bills_billtype = bills_data['Bill Type']
labels_bills_sponser_affiliation = bills_data['Sponser Affiliation']
labels_bills_sponser_state = bills_data['Sponser State']
labels_bills_committees = bills_data['Committees']
labels_bills_combined = bills_data['LABEL'].to_list()

## Party Platform Data
labels_party_party = party_data['Party']
news_data.head(2)
| LABEL | Party | publisher | aapi | abandon | abandoned | abc | ability | able | abolish | ... | yes | york | young | youth | zealot | zeldin | zero | zers | zone | zuckerberg | |
|---|---|---|---|---|---|---|---|---|---|---|---|---|---|---|---|---|---|---|---|---|---|
| 0 | Republican | The Verge | Republican | The Verge | 0.0 | 0.0 | 0.0 | 0.0 | 0.0 | 0.0 | 0.0 | ... | 0.0 | 0.0 | 0.0 | 0.0 | 0.0 | 0.0 | 0.0 | 0.0 | 0.0 | 0.0 |
| 1 | Republican | Gizmodo.com | Republican | Gizmodo.com | 0.0 | 0.0 | 0.0 | 0.0 | 0.0 | 0.0 | 0.0 | ... | 0.0 | 0.0 | 0.0 | 0.0 | 0.0 | 0.0 | 0.0 | 0.0 | 0.0 | 0.0 |
2 rows × 2361 columns
bills_data.head(2)
| LABEL | Bill Type | Sponser Affiliation | Sponser State | Committees | aa | aaa | aarhu | ab | abandon | ... | zoe | zone | zonea | zonesnotwithstand | zoneth | zoo | zoolog | zoonot | zooplankton | zquez | |
|---|---|---|---|---|---|---|---|---|---|---|---|---|---|---|---|---|---|---|---|---|---|
| 0 | hr | D | HI | hr | D | HI | House - Natural Resources, Agriculture | Senat... | 0 | 0 | 0 | 0 | 0 | ... | 0 | 0 | 0 | 0 | 0 | 0 | 0 | 0 | 0 | 0 |
| 1 | hr | R | NY | hr | R | NY | House - Agriculture | 0 | 0 | 0 | 0 | 0 | ... | 0 | 0 | 0 | 0 | 0 | 0 | 0 | 0 | 0 | 0 |
2 rows × 15494 columns
party_data.head()
| Party | ability | able | abortion | access | accessible | according | accountability | accountable | achieved | ... | won | word | work | worker | working | world | worship | worst | year | young | |
|---|---|---|---|---|---|---|---|---|---|---|---|---|---|---|---|---|---|---|---|---|---|
| 0 | Republican | 1 | 1 | 1 | 4 | 1 | 1 | 1 | 4 | 1 | ... | 1 | 1 | 4 | 15 | 2 | 15 | 2 | 1 | 7 | 7 |
| 1 | Democrat | 7 | 13 | 13 | 72 | 15 | 1 | 6 | 14 | 1 | ... | 10 | 1 | 101 | 79 | 81 | 69 | 4 | 4 | 149 | 10 |
2 rows × 893 columns
2. Data Preparation
2.1 Generating a Train Test Split for the Data
2.1.1 News Data
## Creating individually labeled sets for the data

news_data_label_party = news_data.drop(columns = ['publisher', 'LABEL'])
data_train_news_party, data_test_news_party, labels_train_news_party, labels_test_news_party = train_test_splitter(news_data_label_party,'Party')

news_data_label_publisher = news_data.drop(columns = ['Party', 'LABEL'])
data_train_news_publisher, data_test_news_publisher, labels_train_news_publisher, labels_test_news_publisher = train_test_splitter(news_data_label_publisher,'publisher')

news_data_label_combined = news_data.drop(columns = ['Party', 'publisher'])
data_train_news_combined, data_test_news_combined, labels_train_news_combined, labels_test_news_combined = train_test_splitter(news_data_label_combined,'LABEL')
bills_data_label_party = bills_data.drop(columns = ['LABEL', 'Bill Type', 'Sponser State', 'Committees'])
data_train_bills_party, data_test_bills_party, labels_train_bills_party, labels_test_bills_party = train_test_splitter(bills_data_label_party,'Sponser Affiliation')


bills_data_label_state = bills_data.drop(columns = ['LABEL', 'Bill Type', 'Sponser Affiliation', 'Committees'])
data_train_bills_state, data_test_bills_state, labels_train_bills_state, labels_test_bills_state = train_test_splitter(bills_data_label_state,'Sponser State')


bills_data_label_combined = bills_data.drop(columns = ['Sponser State', 'Bill Type', 'Sponser Affiliation', 'Committees'])
data_train_bills_combined, data_test_bills_combined, labels_train_bills_combined, labels_test_bills_combined = train_test_splitter(bills_data_label_combined,'LABEL')

bills_data_label_type = bills_data.drop(columns = ['LABEL', 'Sponser State', 'Sponser Affiliation', 'Committees'])
data_train_bills_type, data_test_bills_type, labels_train_bills_type, labels_test_bills_type = train_test_splitter(bills_data_label_type,'Bill Type')

bills_data_label_committee = bills_data.drop(columns = ['LABEL', 'Bill Type', 'Sponser Affiliation', 'Sponser State'])
data_train_bills_committee, data_test_bills_committee, labels_train_bills_committee, labels_test_bills_committee = train_test_splitter(bills_data_label_committee,'Committees')
length_data = [['News Headline: Partisian Affiliation',len(data_train_news_party), len(data_test_news_party)],
['News Headlines: Publisher',len(data_train_news_publisher), len(data_test_news_publisher)],
['News Headlines: Publisher and Partisian Affiliation',len(data_train_news_combined), len(data_test_news_combined)],
['Climate Bills: Sponsor Affiliation',len(data_train_bills_party), len(data_test_bills_party)],
['Climate Bills: Sponsor State',len(data_train_bills_state), len(data_test_bills_state)],
['Climate Bills: Metadata',len(data_train_bills_combined), len(data_test_bills_combined)],
['Climate Bills: Bill Type',len(data_train_bills_type), len(data_test_bills_type)],
['Climate Bills: Hearing Committee',len(data_train_bills_committee), len(data_test_bills_committee)]]

headers = ['', ' Training Data', 'Testing Data']

length_table = tabulate(length_data, headers=headers, tablefmt='html', numalign='center', stralign = 'left')

with open("Decision Tree - Train Test Split Lengths.html", "w") as file:
    file.write(length_table)

length_table
| Training Data | Testing Data | |
|---|---|---|
| News Headline: Partisian Affiliation | 573 | 246 |
| News Headlines: Publisher | 573 | 246 |
| News Headlines: Publisher and Partisian Affiliation | 573 | 246 |
| Climate Bills: Sponsor Affiliation | 2256 | 967 |
| Climate Bills: Sponsor State | 2256 | 967 |
| Climate Bills: Metadata | 2256 | 967 |
| Climate Bills: Bill Type | 2256 | 967 |
| Climate Bills: Hearing Committee | 2256 | 967 |
3. Training the Decision Tree Model
def tree_modeler(data_train, labels_train, data_test, labels_test, label_column_name, feature_names, graph_title, labels_name, file_name,filter_top_n = False, N=10 ,fig_x = 6, fig_y = 4):
3.1 News Headlines
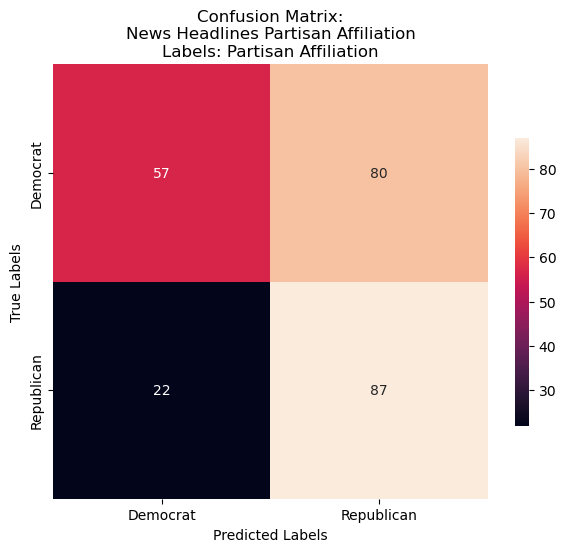
3.1.1 Gini
accuracy_news_data_party, precision_news_data_party, recall_news_data_party = tree_modeler(data_train_news_party, labels_train_news_party,
                                                                                         data_test_news_party, labels_test_news_party,
                                                                                          'Party',
                                                                                         'News Headlines Partisan Affiliation', 'Partisan Affiliation', 'decision tree gini cm- news partisian affiliation.png',
                                                                                         False, 10,fig_x = 6, fig_y = 6)
accuracy_news_data_publisher, precision_news_data_publisher, recall_news_data_publisher = tree_modeler(data_train_news_publisher, labels_train_news_publisher,
                                                                                         data_test_news_publisher, labels_test_news_publisher,
                                                                                          'publisher',
                                                                                         'News Headlines Publisher', 'Publisher', 'decision tree gini cm - news publisher.png',
                                                                                         True, 10,fig_x = 6, fig_y = 6)

accuracy_news_data_combined, precision_news_data_combined, recall_news_data_combined = tree_modeler(data_train_news_combined, labels_train_news_combined,
                                                                                         data_test_news_combined, labels_test_news_combined,
                                                                                          'LABEL',
                                                                                         'News Headlines Metadata', 'Publisher and Partisan Affiliation', 'decision tree gini cm - news metadata.png',
                                                                                         True, 10,fig_x = 12, fig_y = 12)
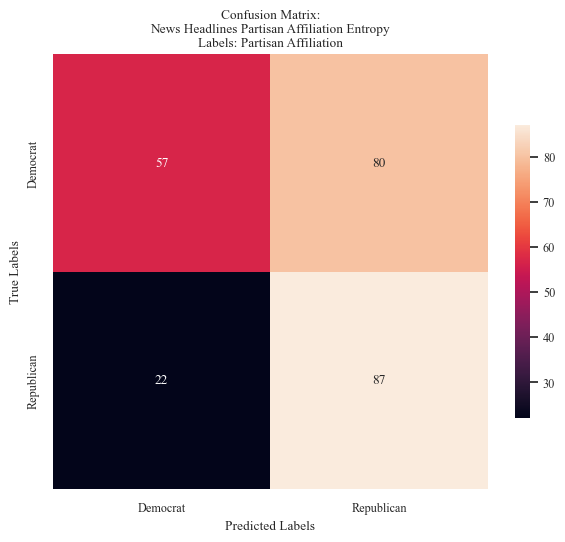
3.2.2 Entropy
accuracy_news_data_party, precision_news_data_party, recall_news_data_party = tree_modeler(data_train_news_party, labels_train_news_party,
                                                                                         data_test_news_party, labels_test_news_party,
                                                                                          'Party',
                                                                                         'News Headlines Partisan Affiliation Entropy', 'Partisan Affiliation', 'decision tree entropy cm- news partisian affiliation.png',
                                                                                         False, 10,fig_x = 6, fig_y = 6)
accuracy_news_data_publisher, precision_news_data_publisher, recall_news_data_publisher = tree_modeler(data_train_news_publisher, labels_train_news_publisher,
                                                                                         data_test_news_publisher, labels_test_news_publisher,
                                                                                          'publisher',
                                                                                         'News Headlines Publisher Entropy', 'Publisher', 'decision tree entropy cm - news publisher.png',
                                                                                         True, 10,fig_x = 6, fig_y = 6)
accuracy_news_data_combined, precision_news_data_combined, recall_news_data_combined = tree_modeler(data_train_news_combined, labels_train_news_combined,
                                                                                         data_test_news_combined, labels_test_news_combined,
                                                                                          'LABEL',
                                                                                         'News Headlines Metadata Entropy', 'Publisher and Partisan Affiliation', 'decision tree entropy cm - news metadata.png',
                                                                                         True, 10,fig_x = 6, fig_y = 6)
3.2 Climate Bills Data
3.2.1 Gini
accuracy_bills_data_party, precision_bills_data_party, recall_bills_data_party = tree_modeler(data_train_bills_party, labels_train_bills_party,
                                                                                         data_test_bills_party, labels_test_bills_party,
                                                                                          'Sponser Affiliation',
                                                                                         'Climate Bills Sponsor Affiliation', 'Partisan Affiliation', 'decision tree gini cm- bills partisian affiliation.png',
                                                                                         False, 10,fig_x = 6, fig_y = 6)

accuracy_bills_data_state, precision_bills_data_state, recall_bills_data_state = tree_modeler(data_train_bills_state, labels_train_bills_state,
                                                                                         data_test_bills_state, labels_test_bills_state,
                                                                                          'Sponser State',
                                                                                         'Climate Bills Sponsor State', 'Sponsor State', 'decision tree gini cm- bills sponsor state.png',
                                                                                         True, 20 ,fig_x = 6, fig_y = 6)

accuracy_bills_data_combined, precision_bills_data_combined, recall_bills_data_combined = tree_modeler(data_train_bills_combined, labels_train_bills_combined,
                                                                                         data_test_bills_combined, labels_test_bills_combined,
                                                                                          'LABEL',
                                                                                         'Climate Bills Metadata', 'Metadata', 'decision tree gini cm- bills combined label.png',
                                                                                         True, 20 ,fig_x = 6, fig_y = 6)

accuracy_bills_data_type, precision_bills_data_type, recall_bills_data_type = tree_modeler(data_train_bills_type, labels_train_bills_type,
                                                                                         data_test_bills_type, labels_test_bills_type,
                                                                                          'Bill Type',
                                                                                         'Climate Bill Type', 'Bill Type', 'decision tree gini cm- bill type label.png',
                                                                                         False, 20 ,fig_x = 6, fig_y = 6)

accuracy_bills_data_committee, precision_bills_data_committee, recall_bills_data_committee = tree_modeler(data_train_bills_committee, labels_train_bills_committee,
                                                                                         data_test_bills_committee, labels_test_bills_committee,
                                                                                          'Committees',
                                                                                         'Climate Bill Committees', 'Hearing Committee', 'decision tree gini cm- bill committee label.png',
                                                                                         False, 5 ,fig_x = 12, fig_y = 12)
3.2.2 Entropy
accuracy_bills_data_party, precision_bills_data_party, recall_bills_data_party = tree_modeler(data_train_bills_party, labels_train_bills_party,
                                                                                         data_test_bills_party, labels_test_bills_party,
                                                                                          'Sponser Affiliation',
                                                                                         'Climate Bills Sponsor Affiliation Entropy', 'Partisan Affiliation', 'decision tree entropy cm- bills partisian affiliation.png',
                                                                                         False, 10,fig_x = 6, fig_y = 6)

accuracy_bills_data_state, precision_bills_data_state, recall_bills_data_state = tree_modeler(data_train_bills_state, labels_train_bills_state,
                                                                                         data_test_bills_state, labels_test_bills_state,
                                                                                          'Sponser State',
                                                                                         'Climate Bills Sponsor State Entropy', 'Sponsor State', 'decision tree entropy cm- bills sponsor state.png',
                                                                                         True, 20 ,fig_x = 6, fig_y = 6)

accuracy_bills_data_combined, precision_bills_data_combined, recall_bills_data_combined = tree_modeler(data_train_bills_combined, labels_train_bills_combined,
                                                                                         data_test_bills_combined, labels_test_bills_combined,
                                                                                          'LABEL',
                                                                                         'Climate Bills Metadata Entropy', 'Metadata', 'decision tree entropy cm- bills combined label.png',
                                                                                         True, 20 ,fig_x = 6, fig_y = 6)

accuracy_bills_data_type, precision_bills_data_type, recall_bills_data_type = tree_modeler(data_train_bills_type, labels_train_bills_type,
                                                                                         data_test_bills_type, labels_test_bills_type,
                                                                                          'Bill Type',
                                                                                         'Climate Bill Type Entropy', 'Bill Type', 'decision tree entropy cm- bill type label.png',
                                                                                         False, 20 ,fig_x = 6, fig_y = 6)

accuracy_bills_data_committee, precision_bills_data_committee, recall_bills_data_committee = tree_modeler(data_train_bills_committee, labels_train_bills_committee,
                                                                                         data_test_bills_committee, labels_test_bills_committee,
                                                                                          'Committees',
                                                                                         'Climate Bill Committees Entropy', 'Hearing Committee', 'decision tree entropy cm- bill committee label.png',
                                                                                         False, 10 ,fig_x = 12, fig_y = 12)
4. Assessing Validity
4.1 Gini
data = [['News Headlines: Partisian Affiliation',accuracy_news_data_party, precision_news_data_party, recall_news_data_party],
['News Headlines: Publisher',accuracy_news_data_publisher, precision_news_data_publisher, recall_news_data_publisher],
['News Headlines: Publisher and Partisian Affiliation',accuracy_news_data_combined, precision_news_data_combined, recall_news_data_combined],
['Climate Bills: Sponsor Affiliation',accuracy_bills_data_party, precision_bills_data_party, recall_bills_data_party],
['Climate Bills: Sponsor State',accuracy_bills_data_state, precision_bills_data_state, recall_bills_data_state],
['Climate Bills: Metadata',accuracy_bills_data_combined, precision_bills_data_combined, recall_bills_data_combined],
['Climate Bills: Bill Type',accuracy_bills_data_type, precision_bills_data_type, recall_bills_data_type],
['Climate Bills: Hearing Committee',accuracy_bills_data_committee, precision_bills_data_committee, recall_bills_data_committee]]


for row in data:
    for i in range(1, 4):  # Loop over the columns with numeric data (index 1, 2, 3)
        row[i] = round(row[i], 3)

headers = ['', ' Accuracy', 'Precision', 'Recall']

table = tabulate(data, headers=headers, tablefmt='html', numalign='center', stralign = 'left')

with open("Decision Tree Gini - Model Evaluation.html", "w") as file:
    file.write(table)
data = [['News Headlines:\n Partisian Affiliation',accuracy_news_data_party, precision_news_data_party, recall_news_data_party],
['News Headlines:\n Publisher',accuracy_news_data_publisher, precision_news_data_publisher, recall_news_data_publisher],
['News Headlines:\n Publisher and\nPartisian Affiliation',accuracy_news_data_combined, precision_news_data_combined, recall_news_data_combined],
['Climate Bills:\n Sponsor Affiliation',accuracy_bills_data_party, precision_bills_data_party, recall_bills_data_party],
['Climate Bills:\n Sponsor State',accuracy_bills_data_state, precision_bills_data_state, recall_bills_data_state],
['Climate Bills:\n Metadata',accuracy_bills_data_combined, precision_bills_data_combined, recall_bills_data_combined],
['Climate Bills:\n Bill Type',accuracy_bills_data_type, precision_bills_data_type, recall_bills_data_type],
['Climate Bills:\n Hearing Committee',accuracy_bills_data_committee, precision_bills_data_committee, recall_bills_data_committee]]


for row in data:
    for i in range(1, 4):  # Loop over the columns with numeric data (index 1, 2, 3)
        row[i] = round(row[i], 3)

model_eval = pd.DataFrame(data, columns=['Model','Accuracy','Precision','Recall'])


fig, ax = plt.subplots(figsize=(12,4))
sb.set_style("white")
sb.set(font='Times New Roman', font_scale=0.8)
ax.set_facecolor('white')

models = model_eval['Model'].to_list()
precision = model_eval['Precision'].to_list()
accuracy = model_eval['Accuracy'].to_list()
recall = model_eval['Recall'].to_list()


ax.set_facecolor('white')

# Width of the bars
bar_width = 0.2


index = np.arange(len(models))

# Plotting bars for Precision, Accuracy, and Recall
bar_precision = ax.bar(index - bar_width, precision, bar_width, label='Precision', color='#2d3142')
bar_accuracy = ax.bar(index, accuracy, bar_width, label='Accuracy', color='#70a9a1')
bar_recall = ax.bar(index + bar_width, recall, bar_width, label='Recall', color='#e94f37')

# Label each bar (with conditional floating & arrow)
def annotate_bars(bars):
    for bar in bars:
        x = bar.get_x() + bar.get_width() / 2
        y = bar.get_height()
        if y < 0.05:
            ax.annotate(
                f'{y:.2f}',
                xy=(x, y),
                xytext=(x, 0.15),
                textcoords='data',
                ha='center', va='bottom',
                arrowprops=dict(arrowstyle='->', color='gray'),
                fontsize=9,
                color='black'
            )
        else:
            ax.text(x, y + 0.02, f'{y:.2f}', ha='center', va='bottom', fontsize=9)

# Apply annotation
annotate_bars(bar_precision)
annotate_bars(bar_accuracy)
annotate_bars(bar_recall)

ax.set_title("Gini Model Evaluation: Illustrating Accuracy, Precision, and Recall\n", fontsize=14)
ax.set_xlabel("")
ax.set_ylabel("Evaluation Score")
ax.tick_params(axis='x')


ax.set_xticks(index)
ax.set_xticklabels(models)
ax.xaxis.set_minor_locator(AutoMinorLocator(5))

ax.legend()

plt.tight_layout()

plt.savefig("Decision Trees Gini - Model Evaluation.png",dpi=1000)
plt.show();

4.2 Entropy
data = [['News Headlines: Partisian Affiliation',accuracy_news_data_party, precision_news_data_party, recall_news_data_party],
['News Headlines: Publisher',accuracy_news_data_publisher, precision_news_data_publisher, recall_news_data_publisher],
['News Headlines: Publisher and Partisian Affiliation',accuracy_news_data_combined, precision_news_data_combined, recall_news_data_combined],
['Climate Bills: Sponsor Affiliation',accuracy_bills_data_party, precision_bills_data_party, recall_bills_data_party],
['Climate Bills: Sponsor State',accuracy_bills_data_state, precision_bills_data_state, recall_bills_data_state],
['Climate Bills: Metadata',accuracy_bills_data_combined, precision_bills_data_combined, recall_bills_data_combined],
['Climate Bills: Bill Type',accuracy_bills_data_type, precision_bills_data_type, recall_bills_data_type],
['Climate Bills: Hearing Committee',accuracy_bills_data_committee, precision_bills_data_committee, recall_bills_data_committee]]


for row in data:
    for i in range(1, 4):  # Loop over the columns with numeric data (index 1, 2, 3)
        row[i] = round(row[i], 3)

headers = ['', ' Accuracy', 'Precision', 'Recall']

table = tabulate(data, headers=headers, tablefmt='html', numalign='center', stralign = 'left')

with open("Decision Tree Entropy - Model Evaluation.html", "w") as file:
    file.write(table)
data = [['News Headlines:\n Partisian Affiliation',accuracy_news_data_party, precision_news_data_party, recall_news_data_party],
['News Headlines:\n Publisher',accuracy_news_data_publisher, precision_news_data_publisher, recall_news_data_publisher],
['News Headlines:\n Publisher and\nPartisian Affiliation',accuracy_news_data_combined, precision_news_data_combined, recall_news_data_combined],
['Climate Bills:\n Sponsor Affiliation',accuracy_bills_data_party, precision_bills_data_party, recall_bills_data_party],
['Climate Bills:\n Sponsor State',accuracy_bills_data_state, precision_bills_data_state, recall_bills_data_state],
['Climate Bills:\n Metadata',accuracy_bills_data_combined, precision_bills_data_combined, recall_bills_data_combined],
['Climate Bills:\n Bill Type',accuracy_bills_data_type, precision_bills_data_type, recall_bills_data_type],
['Climate Bills:\n Hearing Committee',accuracy_bills_data_committee, precision_bills_data_committee, recall_bills_data_committee]]


for row in data:
    for i in range(1, 4):  # Loop over the columns with numeric data (index 1, 2, 3)
        row[i] = round(row[i], 3)

model_eval = pd.DataFrame(data, columns=['Model','Accuracy','Precision','Recall'])


fig, ax = plt.subplots(figsize=(12,4))
sb.set_style("white")
sb.set(font='Times New Roman', font_scale=0.8)
ax.set_facecolor('white')

models = model_eval['Model'].to_list()
precision = model_eval['Precision'].to_list()
accuracy = model_eval['Accuracy'].to_list()
recall = model_eval['Recall'].to_list()


ax.set_facecolor('white')

# Width of the bars
bar_width = 0.2


index = np.arange(len(models))

# Plotting bars for Precision, Accuracy, and Recall
bar_precision = ax.bar(index - bar_width, precision, bar_width, label='Precision', color='#2d3142')
bar_accuracy = ax.bar(index, accuracy, bar_width, label='Accuracy', color='#70a9a1')
bar_recall = ax.bar(index + bar_width, recall, bar_width, label='Recall', color='#e94f37')

# Label each bar (with conditional floating & arrow)
def annotate_bars(bars):
    for bar in bars:
        x = bar.get_x() + bar.get_width() / 2
        y = bar.get_height()
        if y < 0.05:
            ax.annotate(
                f'{y:.2f}',
                xy=(x, y),
                xytext=(x, 0.15),
                textcoords='data',
                ha='center', va='bottom',
                arrowprops=dict(arrowstyle='->', color='gray'),
                fontsize=9,
                color='black'
            )
        else:
            ax.text(x, y + 0.02, f'{y:.2f}', ha='center', va='bottom', fontsize=9)

# Apply annotation
annotate_bars(bar_precision)
annotate_bars(bar_accuracy)
annotate_bars(bar_recall)

ax.set_title("Entropy Model Evaluation: Illustrating Accuracy, Precision, and Recall\n", fontsize=14)
ax.set_xlabel("")
ax.set_ylabel("Evaluation Score")
ax.tick_params(axis='x')


ax.set_xticks(index)
ax.set_xticklabels(models)
ax.xaxis.set_minor_locator(AutoMinorLocator(5))


ax.legend()

plt.tight_layout()

plt.savefig("Decision Trees Entropy - Model Evaluation.png",dpi=1000)
plt.show();
